Urban Transit Breakdowns Linked to Changes in Mobile Sports Wagering During Commute Peaks
Cameron Albrecht · Jul 21, 2026
Urban Transit Breakdowns Linked to Changes in Mobile Sports Wagering During Commute Peaks
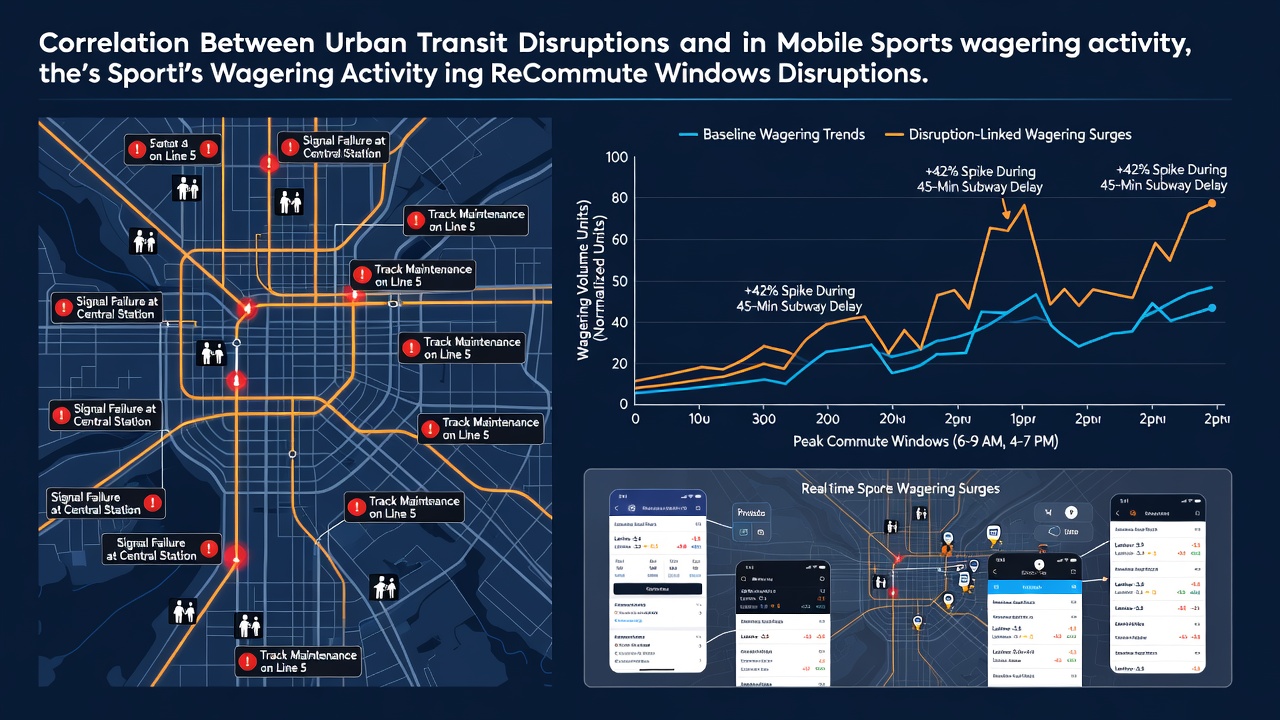
Urban transit systems experience frequent disruptions that alter daily routines for millions of commuters, and researchers have begun mapping these events against mobile sports wagering patterns during peak morning and evening windows. Data from multiple metropolitan areas shows measurable shifts in app engagement and bet placement volumes when trains run late, buses reroute, or service halts occur without warning. Observers note that these correlations emerge most clearly in cities where commuters rely heavily on smartphones during travel segments that normally last twenty to forty minutes.
Peak Commute Windows and Mobile Platform Usage
Peak commute periods typically span 6:30 to 9:30 a.m. and 4:00 to 7:00 p.m. on weekdays, times when public transit ridership reaches its highest levels across North American and European networks. Mobile sports wagering applications record elevated session starts and wager submissions during these same intervals, particularly on days when transit operators report delays exceeding fifteen minutes. Studies tracking anonymized location data paired with betting timestamps reveal that users often initiate new sessions or adjust existing wagers when trains idle in stations or buses sit in traffic longer than scheduled.
Transit agencies in several cities publish real-time delay logs that researchers cross-reference with timestamped wagering records from regulated operators. One analysis covering three consecutive months in 2026 documented a 12 to 18 percent increase in mobile bet submissions within thirty minutes of major subway line stoppages on the same routes. The pattern repeats across different weekdays yet varies by sport season, with higher volumes observed during basketball and baseball schedules that align with evening commutes.
Geographic Patterns Across Cities
Chicago, New York, and Toronto each display distinct signatures when transit incidents intersect with betting activity. In Chicago, delays on the Red Line correlate with spikes in baseball-related wagers placed between 5:00 and 6:30 p.m., while New York data shows broader increases across multiple sports during morning disruptions on the Lexington Avenue line. Toronto researchers recorded similar activity upticks during streetcar service interruptions that force riders to extend their travel time by more than twenty minutes. These geographic differences reflect local team schedules, betting market availability, and typical commute durations rather than uniform national trends.
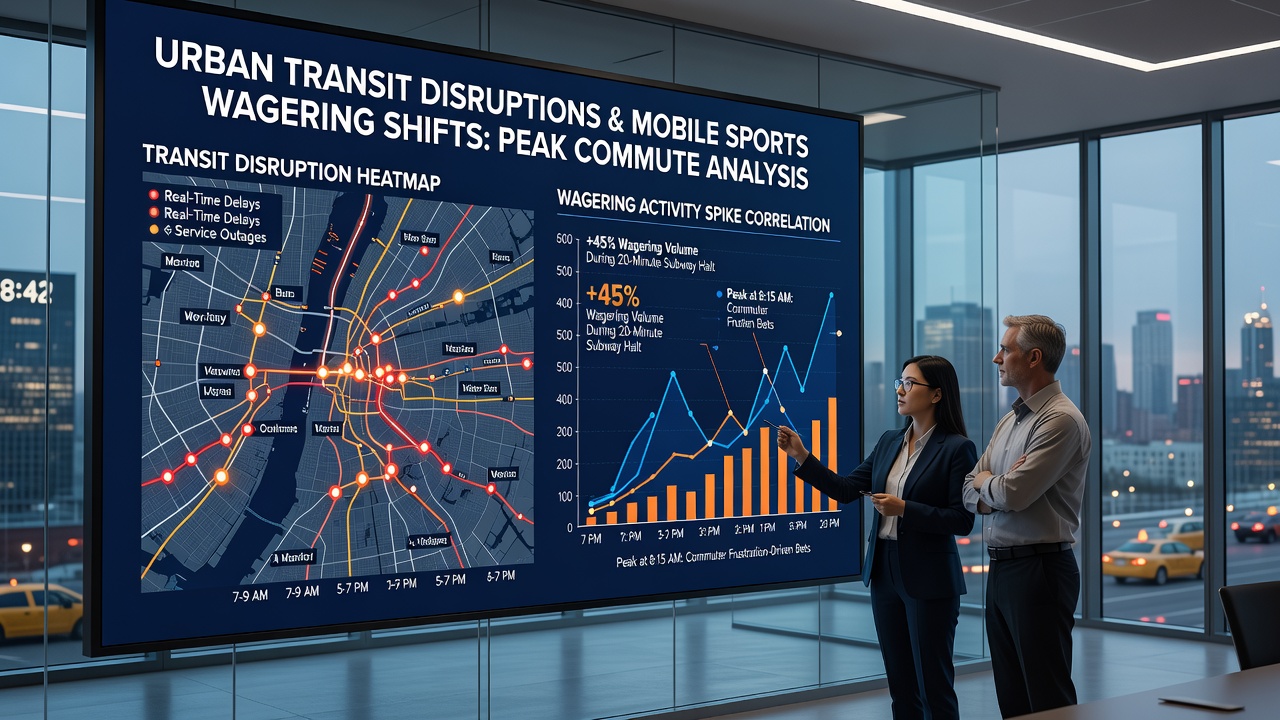
Additional data from July 2026 indicates that summer construction projects amplifying routine delays produced sustained elevation in mobile wagering volumes across affected corridors, with activity returning to baseline levels once service resumed normal schedules. Academic teams at several universities have begun integrating transit API feeds with anonymized operator data to build predictive models that flag potential wagering shifts up to forty-five minutes after an initial service alert.
Measurement Techniques and Data Sources
Researchers combine automated vehicle location feeds from transit authorities with time-stamped transaction logs supplied by licensed sportsbooks under strict privacy protocols. The resulting datasets undergo spatial and temporal alignment to identify overlapping events, and statistical controls account for weather, game schedules, and major news cycles that might independently influence betting behavior. Transport Canada has published aggregate ridership disruption statistics that several academic groups reference when calibrating models for Canadian cities, while the Federal Transit Administration supplies comparable figures for U.S. metropolitan areas.
One study conducted across five U.S. metro regions used machine learning classifiers to isolate delay events lasting longer than ten minutes and then measured subsequent changes in mobile session duration. Results indicated that users on delayed trains spent an average of seven additional minutes engaged with betting apps compared with baseline commute days, and the proportion of in-play wagers rose noticeably during extended station waits. These findings appear in working papers released through university transportation research centers rather than commercial reports.
Policy and Regulatory Context
Regulatory bodies in multiple jurisdictions have begun requesting aggregated mobility and wagering datasets to understand how infrastructure events intersect with gambling activity. The approach allows oversight agencies to monitor whether extended commute times coincide with unusual betting concentrations that might warrant further review. Industry associations representing both transit operators and gaming companies have participated in workshops exploring standardized data-sharing frameworks that preserve user anonymity while enabling longitudinal analysis.
Current efforts focus on refining geofencing accuracy so that delay events can be matched to specific route segments rather than broad city zones. Early pilot programs in two Canadian provinces and one U.S. state have demonstrated that combining open transit data with regulated operator feeds produces reproducible correlation metrics suitable for quarterly reporting.
Conclusion
Mapping urban transit disruptions against mobile sports wagering activity during peak commute windows has emerged as a specialized research area that draws on transportation logs, anonymized transaction data, and spatial analysis techniques. Evidence collected through mid-2026 shows consistent, measurable associations between service interruptions and shifts in betting engagement across several major cities, with patterns varying by local schedules and infrastructure characteristics. Continued refinement of data integration methods and expansion of participating regions will likely strengthen the precision of these correlations in subsequent reporting cycles.